
In 2020, NOMADICS developed a user-friendly, interactive tool to track, monitor, and visualize the localized spread of COVID-19 across New Jersey, including:
- Current information and weekly changes on COVID-19 cases and deaths
- Current information on COVID-19 vaccinations, provided at the county level
- Locations of COVID-19 vaccine providers
This powerful intelligence tool—dubbed Project Broad Street—aggregates and automates publicly-available GIS datasets from various public and private entities, such as The Johns Hopkins University and the Centers for Disease Control and Prevention. The data, mapping interface, and layers are consistently maintained, monitored, and updated by NOMADICS, giving State COVID responders a centralized data platform to contain infections and limit the spread of this deadly pandemic.
The initiative was funded solely by NOMADICS as part of a Research & Development expansion that started in April 2020 and concluded its initial phase in January 2023.
Project Broad Street was nominated for a 2021 ANJEC Environmental Achievement Award.


Throughout 2020 and 2021, Project Broad Street was duplicated for other states and regions. These web maps provide an overview of COVID-19 cases and response resources in various states nationwide. Each featured web map identifies COVID-19 and its hotspots, providing up-to-date information on the number of COVID-19 cases and deaths—along with a weekly percent change in cases and deaths—and the number of administered COVID-19 vaccinations at the county level.
The tool for New Jersey—dubbed Project Broad Street—was duplicated for other states and regions to help curb the spread of the virus on a regional and local level.
GENERAL INSTRUCTIONS
1) Roll over an image below and click to open the specified web map.
2) Within the web map, click on the “Contents” button to display or hide the map layers.
3) Follow the web map’s instructions for operating the COVID-19 Cases Time Slider function.
4) To view the web map’s overview information (such as Terms of Use and Credits), click on the “About” button and “More Details…”
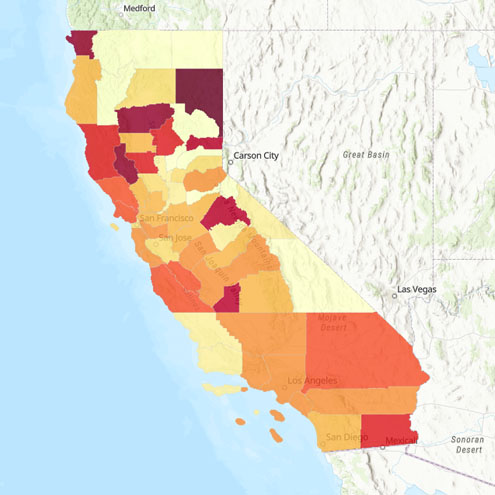
California COVID-19 Tracker
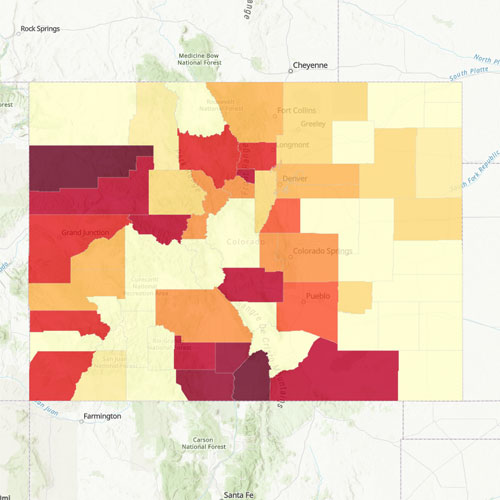
Colorado COVID-19 Tracker
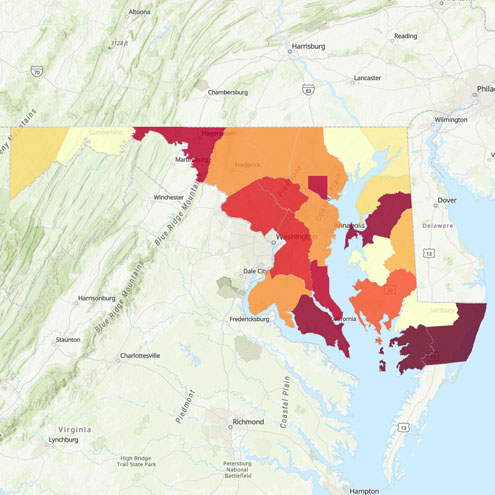
Maryland COVID-19 Tracker
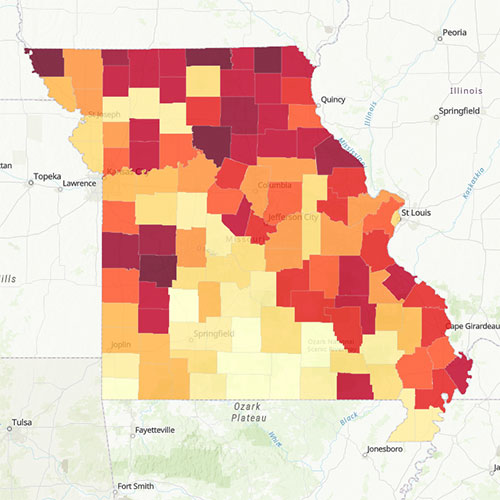
Missouri COVID-19 Tracker
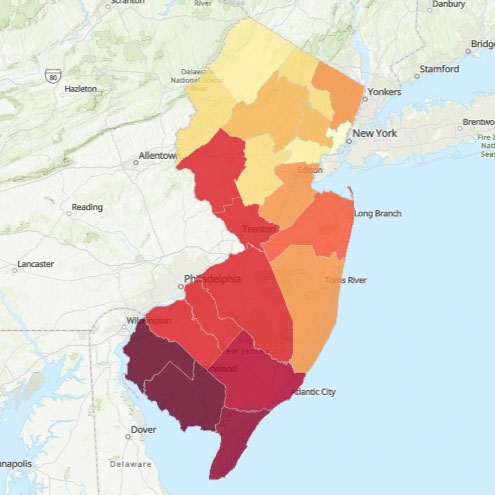
New Jersey COVID-19 Tracker
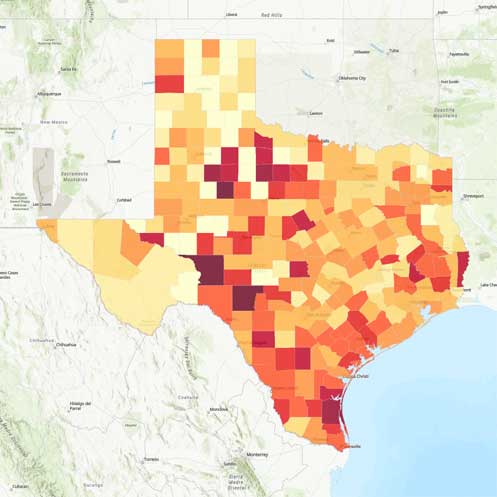
Texas COVID-19 Tracker
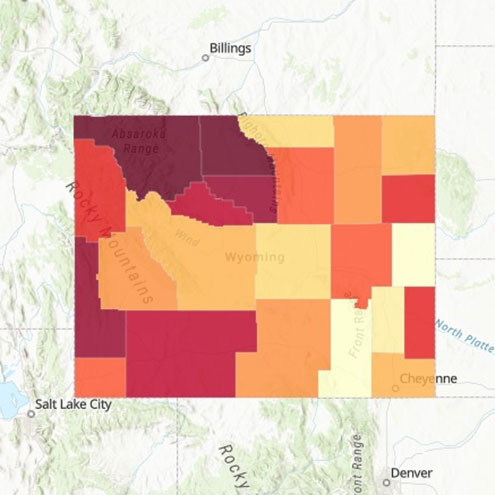
Wyoming COVID-19 Tracker
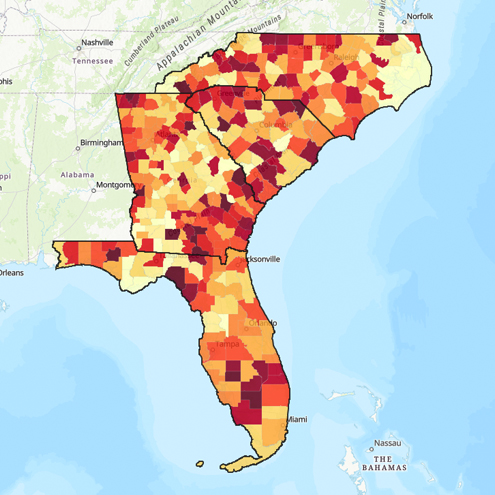
SE United States COVID-19 Tracker
COVID-19 Storm Surge Research
All featured web maps and its contents are for non-commercial research and development purposes only. The web maps were developed using public and private Geographic Information System digital data. NOMADICS dba The Nomad Group, LLC makes no claim to the currency or accuracy of the data displayed.